1.3-create-structured-surface
%matplotlib inline
from pyvista import set_plot_theme
set_plot_theme('document')
Creating a Structured Surface
Create a StructuredGrid surface from NumPy arrays
# sphinx_gallery_thumbnail_number = 2
import pyvista as pv
from pyvista import examples
import numpy as np
From NumPy Meshgrid
Create a simple meshgrid using NumPy
# Make data
x = np.arange(-10, 10, 0.25)
y = np.arange(-10, 10, 0.25)
x, y = np.meshgrid(x, y)
r = np.sqrt(x ** 2 + y ** 2)
z = np.sin(r)
Now pass the NumPy meshgrid to PyVista
# Create and plot structured grid
grid = pv.StructuredGrid(x, y, z)
grid.plot()# Plot mean curvature as well
grid.plot_curvature(clim=[-1, 1])Generating a structured grid is a one liner in this module, and the points from the resulting surface can be accessed as a NumPy array:
grid.pointspyvista_ndarray([[-10. , -10. , 0.99998766],
[-10. , -9.75 , 0.98546793],
[-10. , -9.5 , 0.9413954 ],
...,
[ 9.75 , 9.25 , 0.76645876],
[ 9.75 , 9.5 , 0.86571785],
[ 9.75 , 9.75 , 0.93985707]])From XYZ Points
Quite often, you might be given a set of coordinates (XYZ points) in a simple
tabular format where there exists some structure such that grid could be
built between the nodes you have. A great example is found in
pyvista-support#16_ where a structured grid that is rotated from the
cartesian reference frame is given as just XYZ points. In these cases, all
that is needed to recover the grid is the dimensions of the grid
(nx by ny by nz) and that the coordinates are ordered appropriately.
For this example, we will create a small dataset and rotate the coordinates such that they are not on orthogonal to cartesian reference frame.
def make_point_set():
    """Ignore the contents of this function. Just know that it returns an
    n by 3 numpy array of structured coordinates."""
    n, m = 29, 32
    x = np.linspace(-200, 200, num=n) + np.random.uniform(-5, 5, size=n)
    y = np.linspace(-200, 200, num=m) + np.random.uniform(-5, 5, size=m)
    xx, yy = np.meshgrid(x, y)
    A, b = 100, 100
    zz = A * np.exp(-0.5 * ((xx / b) ** 2.0 + (yy / b) ** 2.0))
    points = np.c_[xx.reshape(-1), yy.reshape(-1), zz.reshape(-1)]
    foo = pv.PolyData(points)
    foo.rotate_z(36.6)
    return foo.points


# Get the points as a 2D NumPy array (N by 3)
points = make_point_set()
points[0:5, :]
/opt/homebrew/Caskroom/miniforge/base/lib/python3.9/site-packages/pyvista/core/pointset.py:328: PyvistaDeprecationWarning: You did not specify a value for `inplace` and the default value will be changing to `False` in future versions for point-based meshes (e.g., `PolyData`). Please make sure you are not assuming this to be an inplace operation.
warnings.warn(DEFAULT_INPLACE_WARNING, PyvistaDeprecationWarning)
pyvista_ndarray([[ -40.38312538, -282.46584037,    1.70622409],
                 [ -31.37569097, -275.77632922,    2.12403865],
                 [ -14.16627726, -262.99549066,    3.11679307],
                 [  -7.11196726, -257.75649771,    3.59923231],
                 [   2.4199237 , -250.67749075,    4.31853907]])
Now pretend that the (n by 3) NumPy array above are coordinates that you have, possibly from a file with three columns of XYZ points.
We simply need to recover the dimensions of the grid that these points make
and then we can generate a :class:pyvista.StructuredGrid mesh.
Let's preview the points to see what we are dealing with:
import matplotlib.pyplot as plt

plt.figure(figsize=(10, 10))
plt.scatter(points[:, 0], points[:, 1], c=points[:, 2])
plt.axis("image")
plt.xlabel("X Coordinate")
plt.ylabel("Y Coordinate")
plt.show()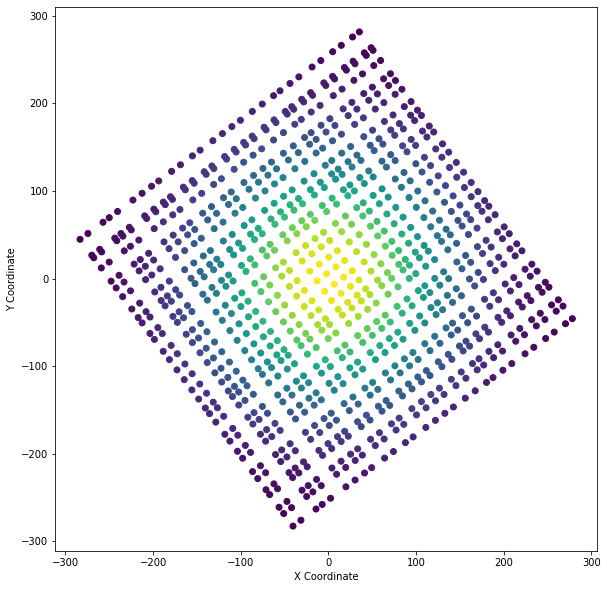
In the figure above, we can see some inherit structure to the points and thus
we could connect the points as a structured grid. All we need to know are the
dimensions of the grid present. In this case, we know (because we made this
dataset) the dimensions are [29, 32, 1], but you might not know the
dimensions of your pointset. There are a few ways to figure out the
dimensionality of structured grid including:
- manually counting the nodes along the edges of the pointset
- using a technique like principle component analysis to strip the rotation from the dataset and count the unique values along each axis for the new;y projected dataset.
# Once you've figured out your grid's dimensions, simple create the
# :class:`pyvista.StructuredGrid` as follows:

mesh = pv.StructuredGrid()
# Set the coordinates from the numpy array
mesh.points = points
# set the dimensions
mesh.dimensions = [29, 32, 1]

# and then inspect it!
mesh.plot(show_edges=True, show_grid=True, cpos="xy")Extending a 2D StructuredGrid to 3D
A 2D :class:pyvista.StructuredGrid mesh can be extended into a 3D mesh.
This is highly applicable when wanting to create a terrain following mesh
in earth science research applications.
For example, we could have a :class:pyvista.StructuredGrid of a topography
surface and extend that surface to a few different levels and connect each
"level" to create the 3D terrain following mesh.
Let's start with a simple example by extending the wave mesh to 3D
struct = examples.load_structured()
struct.plot(show_edges=True)top = struct.points.copy()
bottom = struct.points.copy()
bottom[:,-1] = -10.0 # Wherever you want the plane
vol = pv.StructuredGrid()
vol.points = np.vstack((top, bottom))
vol.dimensions = [*struct.dimensions[0:2], 2]
vol.plot(show_edges=True)